|
The number of days that have passed since the beginning of the New York on PAUSE (March 23, 2020)
Now that more than a month has passed I was able to compile some numbers for a week-by-week comparison rather than looking exclusively at the every-other-day cumulative data I've been sharing up to now. There's a LOT of information to take in. I don't want to overload you. So, here's the exec summary: The local real estate market isn't all doom and gloom even under these very difficult circumstances. The trend lines look promising even if the overall number of listings and transactions are way down compared to last year. All the nitty and the gritty numbers are below.
The virus numbers continue to trend downwards. Governor Cuomo has been devoting more time to his plans for reopening the economy in New York State. Yesterday he indicated the state would likely open up construction and manufacturing businesses around May 15th. In my opinion the first step in reopening the real estate market will not be far behind. Remember, I said the first step would be that real estate agents would be allowed to enter properties ALONE regardless of whether or not the property is vacant. That day is coming and it's coming soon. As always, I am available to talk privately with you about your particular real estate situation. Call, text or FaceTime: 585-732-1767. Email: [email protected]
I'm hosting a Zoom meeting to answer your general questions and talk about the local real estate market.
Monday, April 27, 2020 at 6:30 pm - CLICK HERE TO JOIN THE MEETING Meeting ID: 585 732 1767 Password: 625369 Real estate market data: A week-by-week comparison to last year.
First, a primer on the information you see below. Now that we are more than a month out from the shutdown date of March 23, 2020 we have enough data to compare a series of weeks. There is a natural weekly rhythm to real estate. Each week the cycle tends to repeat. I wanted to see if any interesting trends were emerging that could only be discerned by looking at weekly numbers.
Key real estate numbers in Monroe County for single family homes, townhouses and condominiums:
Looking at the current year under NY on PAUSE:
# Listings: Shows the number of new property listings that were registered in a given week. # Contracts: Shows the number of homes on the market that have an accepted offer (as of April 26, 2020). This column is a bit tricky to understand because a property listed in the first week might receive an offer at any time thereafter. So, the number of listings each week remains constant while the number of purchase contracts changes frequently. To make matters more complicated the number of contracts may go up and down. Why? Because some offers fall apart. As time passes, however, we would expect the "success rate" to rise as more and more properties take offers and those offers eventually close. So, to get an accurate picture of market activity you have to update the information over time. 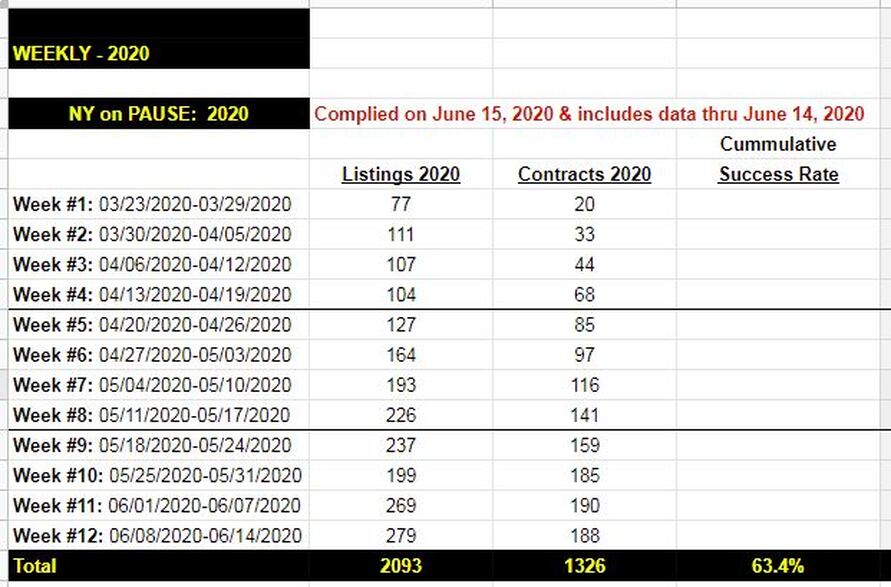
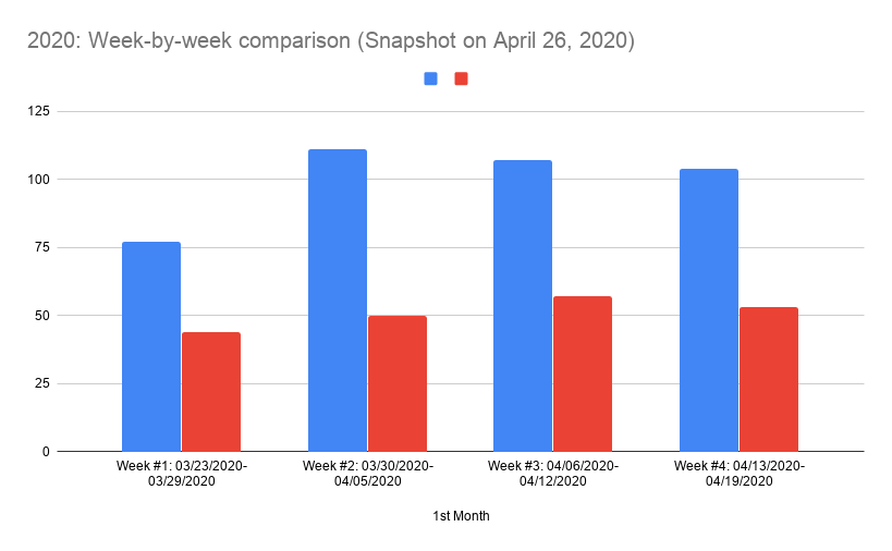
2020 under NY on PAUSE: The number of property listings per week this year and the number of those properties that have accepted an offer per week as registered in the ML database by April 26, 2020.
Looking back to our comparison year of 2019: Where we at this time last year?
# Listings: Shows the number of property listings that were registered in a given week back in 2019. # Contracts: Shows the number of homes on the market back in 2019 that took an offer. Although this data set looks back a full year it is still a snapshot of the market taken on April 26, 2019. So, properties listed on April 17th may not have accepted an offer as of April 26th. 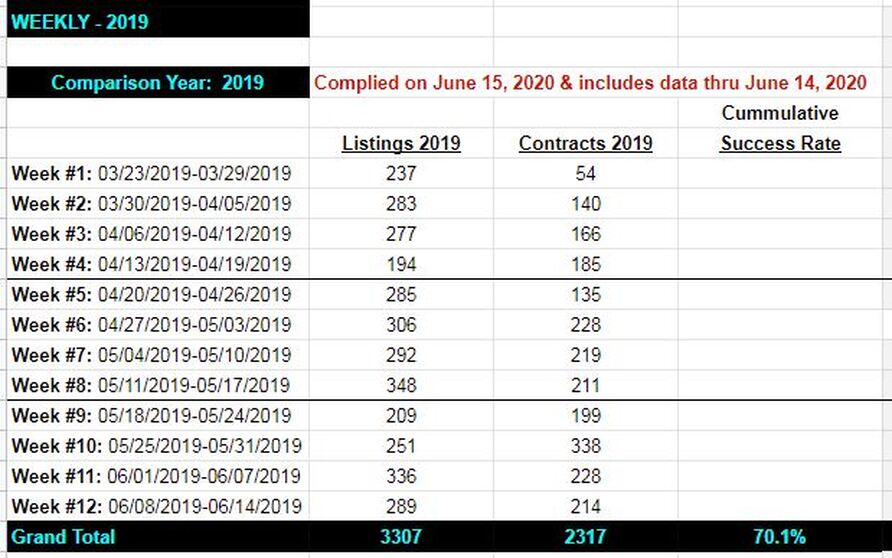
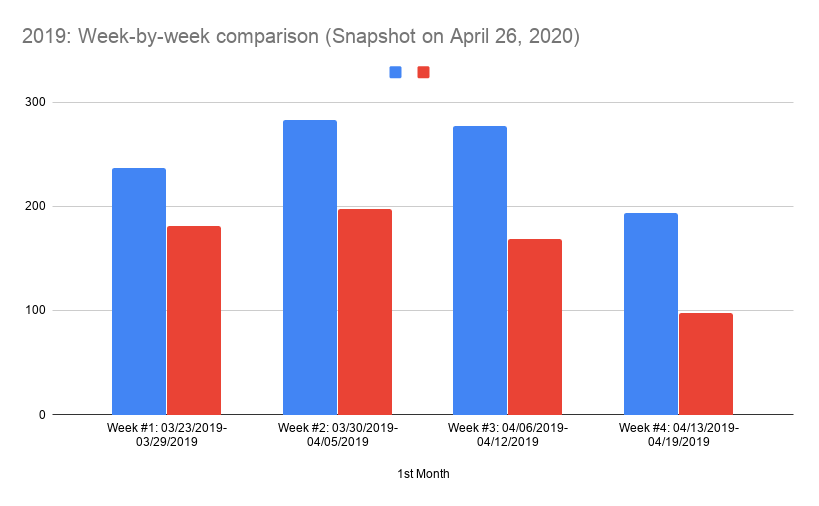
Comparison year of 2019: The number of property listings per week last year (2019) and the number of those properties that had an accepted an offer on a weekly basis (last year) as registered in the ML database.
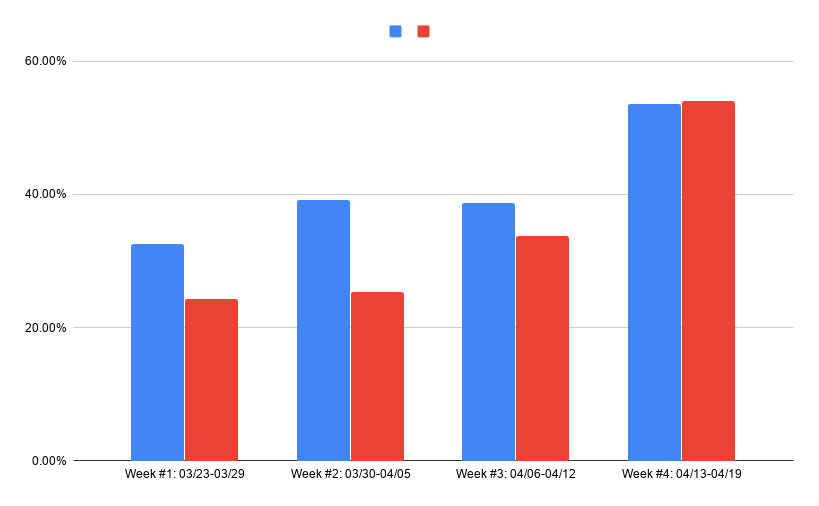
# Listings Comparing 2020 to 2019 as a percentage: This column compares 2020 to 2019 directly by dividing the number of new property listings in a given week in 2020 by the number of new property listings in a given week in 2019 to obtain a percentage. # Contracts Comparing 2020 to 2019 as a percentage: This column compares 2020 to 2019 directly by dividing the number of accepted offers in 2020 (as of April 26, 2020) by the number of accepted offers in 2019 (as of April 26, 2019) to obtain a percentage. 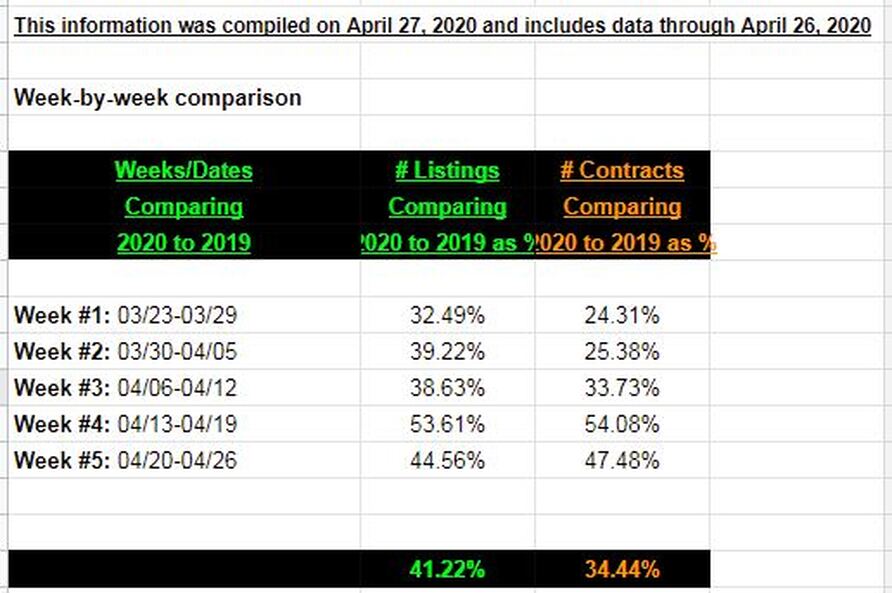
What do the week-by-week data tell us?!
First, and perhaps most importantly, the success rate between this year and last year is down BUT it's not down dramatically and it appears to be getting stronger. Actually, the success rate is better than one would have expected under these circumstances. As a result, it does not appear as though property values are suffering at this stage of the crisis. That is NOT to say property values are rising. In fact, values may still take a hit. We won't know for sure for many months. Still, the fact that a good percentage of properties are accepting offers is a encouraging sign indeed. Second, it appears newer listings are getting more action than older listings. My guess is that buyers entering the market every day are focusing on new listings. "Older" listings (those on the market a week or longer) aren't as highly regarded by buyers as the brand new property listings that pop up moment by moment. Lastly, the overall number of listings and accepted offers are still way, way down compared to last year. I doubt we'll ever catch up to the overall number of transactions.
All of the week-by-week information described above has been embedded in the reports I've been sending up to now. The big difference is the data below offers a cumulative perspective rather than exposing week-by-week trends.
The real estate market in 2020 under the New York on PAUSE restrictions:
The real estate market in 2019:
Cuomo explains his plan to reopen the economy regionally in NYS:
Our Status.
I will continue to post updates related to the metro Rochester real estate market during the coronavirus. The situation is changing rapidly. You deserve the most recent information about our real estate market from a source you trust. I wish you and your loved ones good health and good spirits during this unfortunate crisis! Yours, Rome Celli 585-732-1767 [email protected]
 RSS Feed RSS Feed
Comments are closed.
|
Rome CelliCelebrating over 35 years of commitment to real estates in every corner of our community!
|
